
One cool feature in rdkit is the ability to visually highlight the similarity between two given molecules. In another post (Tanimoto Molecular Similarity Experiment) we saw how to find similar molecules using Tanimoto and Morgan Fingerprints. At the end of the experiment we created an image file with the top 20 similar molecules to D-Aspartate (ZINC000000895218) from a given set. In this blog roll, we look into how this similarity can be visualized using rdkit functions.
The function that does all this is SimilarityMaps.GetSimilarityMapForFingerprint. In the sample below, we will visualize the similarity between molecule D-Aspartate (ZINC000000895218) and L-Ser (ZINC000000895034), shown in the image below.
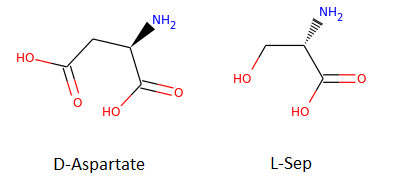
In our previous experiment, the Tanimoto similarity value obtained is 0.55. Let’s do some Python and have fun!
%matplotlib inline
%pylab inline
from IPython.display import Image

from rdkit.Chem import AllChem as Chem
from rdkit.Chem.Draw import IPythonConsole
from rdkit.Chem.Draw import SimilarityMaps

smiles1 = 'N[C@H](CC(=O)O)C(=O)O' #ZINC000000895218 (D-Aspartate)
smiles2 = 'N[C@@H](CO)C(=O)O' #ZINC000000895034 (L-Ser)

mol1 = Chem.MolFromSmiles(smiles1)
mol2 = Chem.MolFromSmiles(smiles2)

SimilarityMaps.GetSimilarityMapForFingerprint(mol2, mol1, SimilarityMaps.GetMorganFingerprint)
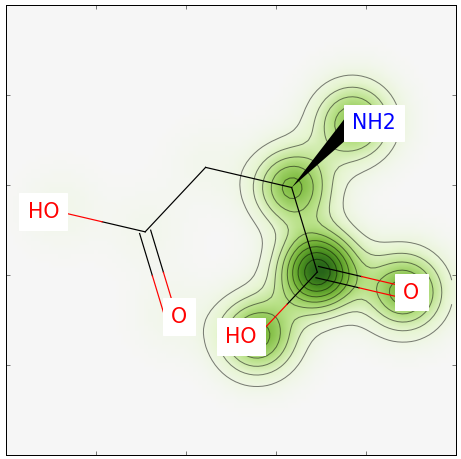
Running the above Python script yields the image below. Note that a bit more than half of our molecule is highlighted; this is expected given that we have a similarity of 0.55.
Pretty simple, eh! Feel free to leave any comments in the section below.
Thanks for reading this post and have fun in your chemoinformatics adventure!